Analytics & Reports
Data-driven dashboards and reports to help you understand performance, identify bottlenecks, and make better business decisions.
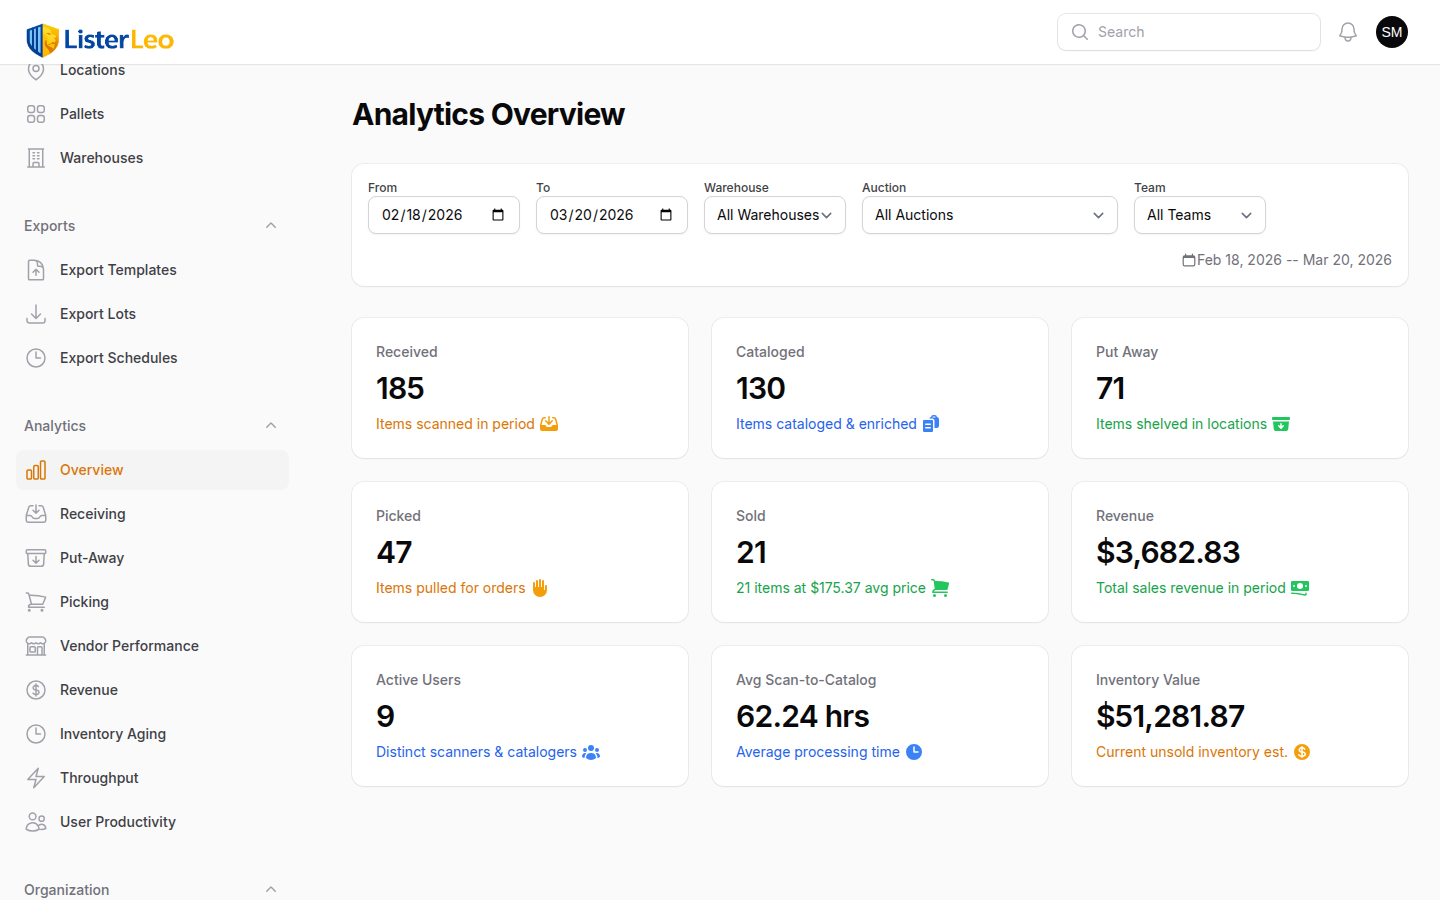
team-lead org-admin org-ownerListerLeo's Analytics section provides detailed dashboards covering every stage of your warehouse operation. From how fast items are scanned to which vendors generate the most revenue, these reports give you the data you need to optimize your workflow.
Accessing Analytics
Expand the Analytics group in the left sidebar to see each report as a separate page: Overview, Receiving, Put-Away, Picking, Vendor Performance, Revenue, Inventory Aging, Throughput, and User Productivity. Access is restricted to users with the org-owner, org-admin, or team-lead role.
Filters & Date Ranges
team-lead org-admin org-ownerAll analytics pages share a common filter bar that lets you narrow data by time period and other criteria.
Date Range
Each page has two date pickers — From and To — that default to the last 30 days. Pick any custom start and end date; there are no preset shortcuts (today/yesterday/last 7 days/etc.) in the current UI.
Additional Filters
- Warehouse — Limit data to items currently located in a specific warehouse.
- Auction — Filter to lots in a specific auction.
- Team — Show only data for lots assigned to a specific team.
Use the date range and filter controls to narrow down the data to the time period and segment you care about most.
Receiving Analytics
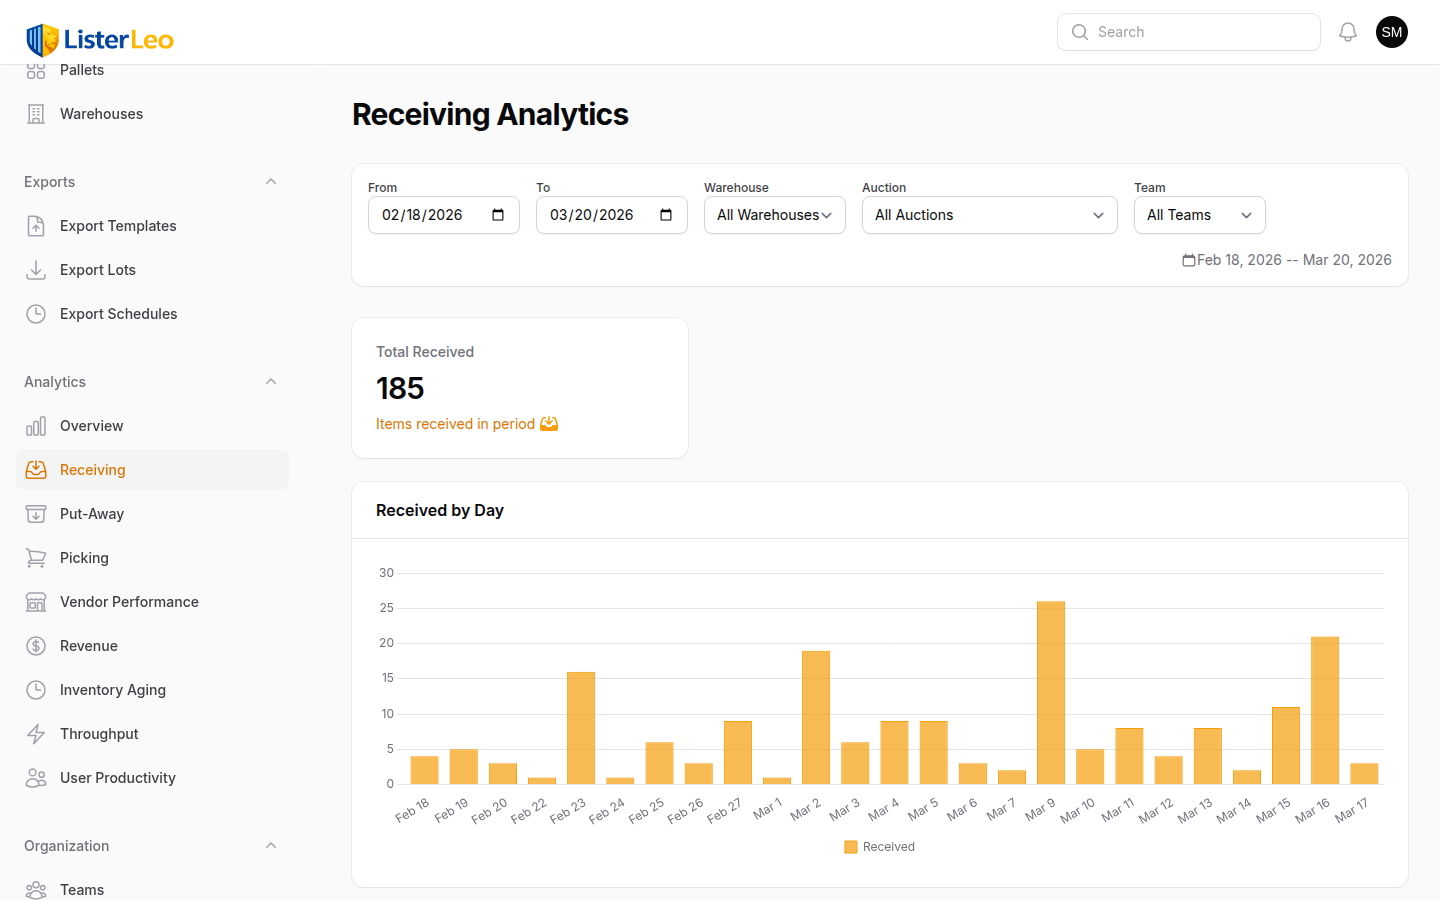
team-lead org-admin org-ownerReceiving analytics track how items enter your system through scanning at the Scanning Station.
Key Metrics
- Total Received — Total items scanned in the selected period (count of items with a
scanned_attimestamp in range). - Daily Trend — A daily chart of items scanned per day.
- By User — Top 20 scanners ranked by item count.
- By Vendor — Top 20 vendors by items received.
- By Warehouse — Items received grouped by warehouse location.
- By Team — Items received grouped by the team assigned to the lot.
- By Hour of Day — Distribution of scanning activity across the 24-hour clock.
Put-Away Analytics
team-lead org-admin org-ownerPut-away analytics measure how efficiently items are moved from the receiving area to warehouse locations.
Key Metrics
- Total Put Away — Total
put_awayactivity-log events in the period. - Daily Trend — Daily chart of put-away events.
- By User — Top 20 users by items put away.
- By Warehouse — Put-away events grouped by warehouse.
- By Location — Top 20 destination locations by put-away count (location code + name).
If the daily put-away count consistently lags daily receiving counts (visible side-by-side on the Throughput page), your put-away team is not keeping up with scanning. Consider adding put-away staff or adjusting shift schedules.
Picking Analytics
team-lead org-admin org-ownerPicking analytics track the throughput of your picking operations.
Key Metrics
- Total Picked — Total pick-list items marked picked in the period.
- Completion Rate — Picked items as a percentage of pick-list items created in the same period.
- Daily Trend — Daily chart of items picked.
- By User — Top 20 pickers by items picked.
A low completion rate means a large share of generated pick-list items are not being fulfilled in the same period — usually because items can't be found at their recorded location or because pickers are not keeping up. Investigate put-away accuracy and shift coverage.
Vendor Performance
team-lead org-admin org-ownerCompare vendors side by side to identify your most profitable sources and underperformers.
Vendor Comparison Table
The vendor performance report shows a per-vendor table with these columns:
- Items Received — Items created in the period sourced from this vendor.
- Items Sold — Items from this vendor that have status
sold. - Sell-Through — Items Sold ÷ Items Received, expressed as a percentage.
- Cost — Sum of
coston items received from this vendor. - Revenue — Sum of
sold_priceon sold items from this vendor. - Est. Value — Sum of
estimated_valueacross all items received.
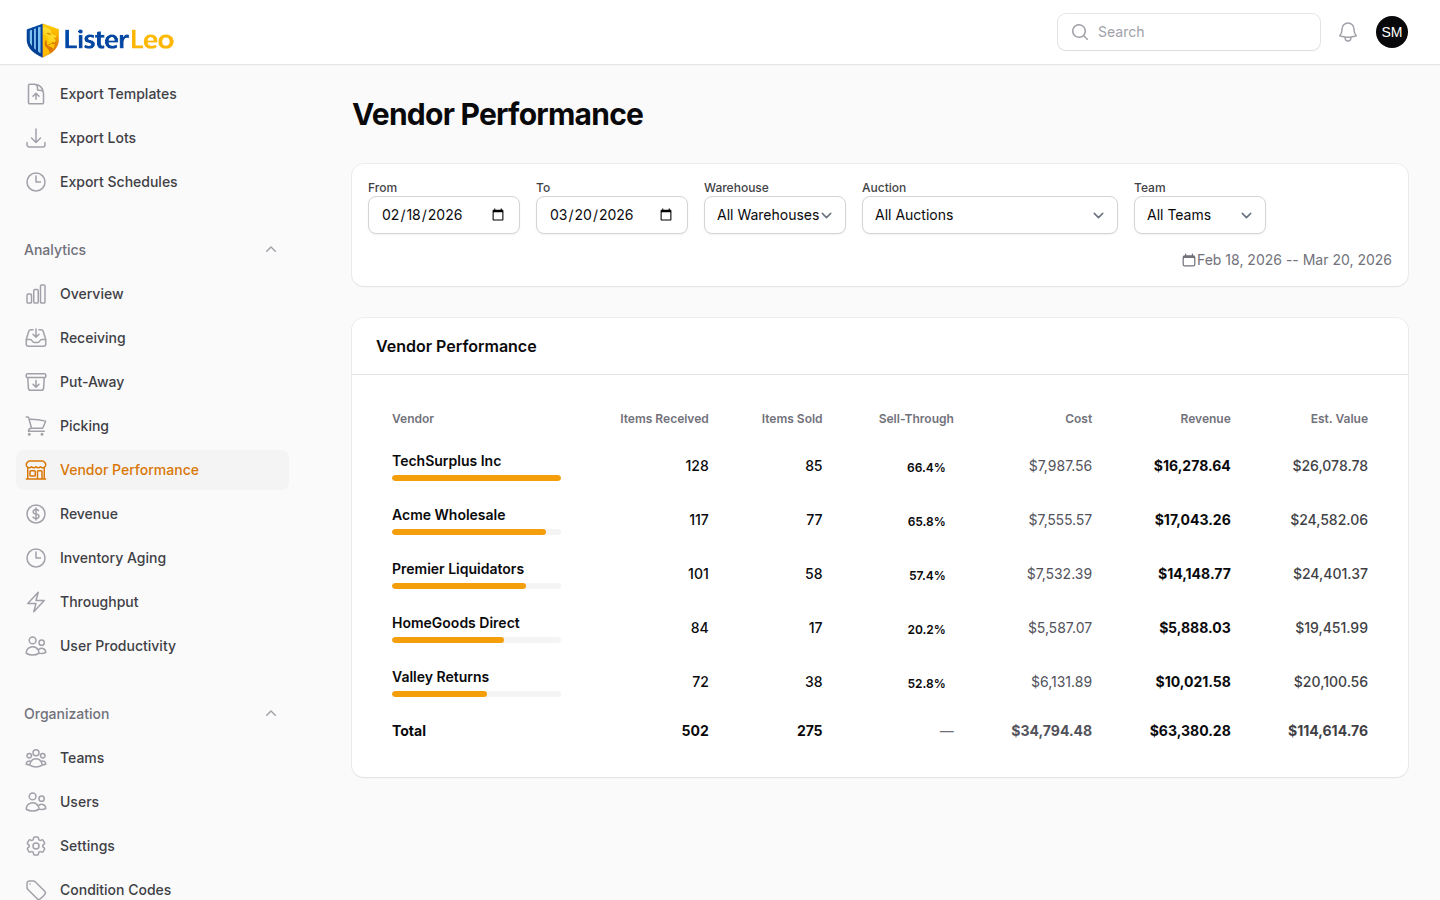
Sell-through is colour-coded: green at 75%+, amber at 50%+, orange at 25%+, red below. Compare Revenue against Cost to gauge profitability and Est. Value against Revenue to see how close your final hammer prices are tracking to expected retail.
Revenue Analytics
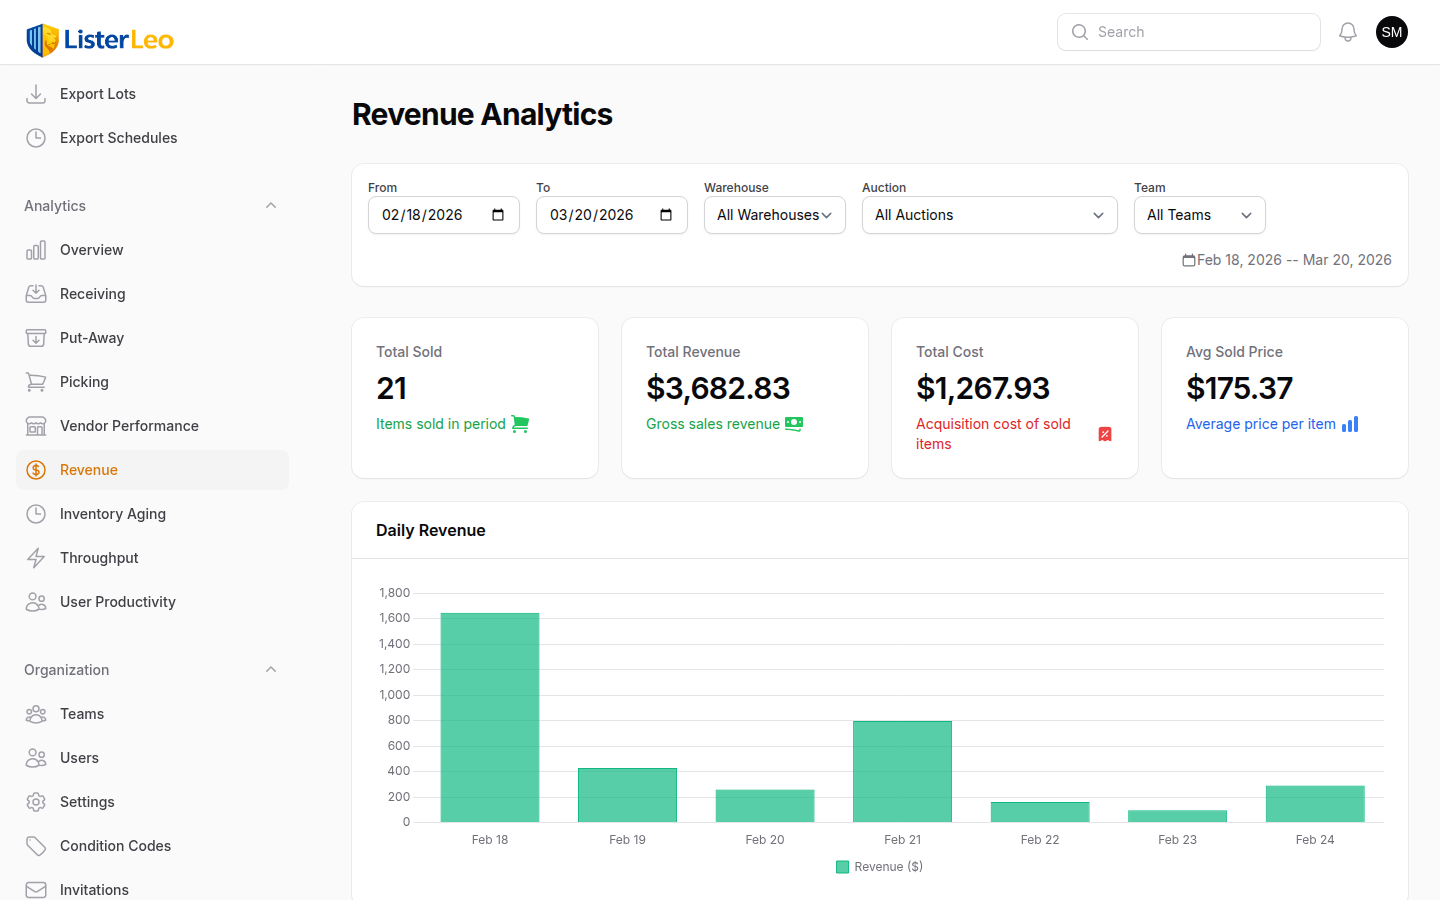
team-lead org-admin org-ownerRevenue analytics provide a financial view of your auction operations.
Revenue Dashboard
- Total Sold — Count of items sold in the period.
- Total Revenue — Sum of
sold_pricefor sold items. - Total Cost — Sum of
costfor sold items (acquisition cost). - Avg Sold Price — Mean
sold_priceacross sold items. - Daily Trend — Line chart of daily item count and revenue.
- By Vendor — Per-vendor breakdown of items sold, revenue, and cost.
Inventory Aging
team-lead org-admin org-ownerThe inventory aging report shows how long items have been sitting in your warehouse without selling. Aging inventory ties up space and capital.
Aging Buckets
Non-sold items are grouped into buckets based on days since the item was created:
- 0-7 days — Recently received items still in the pipeline.
- 8-14 days — Should be lotted and approaching auction.
- 15-30 days — Should have gone through at least one auction cycle.
- 31-60 days — Aging inventory that needs attention.
- 60+ days — Stale inventory that should be repriced, relisted, or disposed of.
Each bucket shows an item count. The page also surfaces a Stale Items stat — the number of non-sold items whose record has not been updated in 30+ days — and a breakdown by status with the average days each item has spent in that status.
Items in the 60+ day bucket are costing you money in warehouse space. Review them regularly and decide whether to lower prices, bundle them into multi-item lots, or dispose of them.
Throughput
team-lead org-admin org-ownerThroughput analytics measure the flow of items through each stage of your operation: scanning, cataloging, put-away, and sale.
Pipeline
The page shows a pipeline widget grouping all items by current status with a count for each. This helps you spot bottlenecks — if items are piling up at a particular status, you can see it at a glance.
Stage Timings
Three average-hours stats, computed over items whose end-of-stage timestamp falls in the selected period:
- Scan to Catalog — Average hours from
scanned_attocataloged_at. - Scan to Put-Away — Average hours from
scanned_atto the put-away activity-log event. - Scan to Sold — Average hours from
scanned_attosold_at(full lifecycle).
Daily Flow
A daily chart overlays four series for each day in the period: scanned, cataloged, put away, and sold. Use it to compare incoming volume against downstream stages and spot where items are stalling.
Benchmark your scan-to-sold time. Industry leaders process items from dock to buyer pickup in under 14 days. If yours is longer, look at scan-to-catalog and scan-to-put-away to find where the delays are.
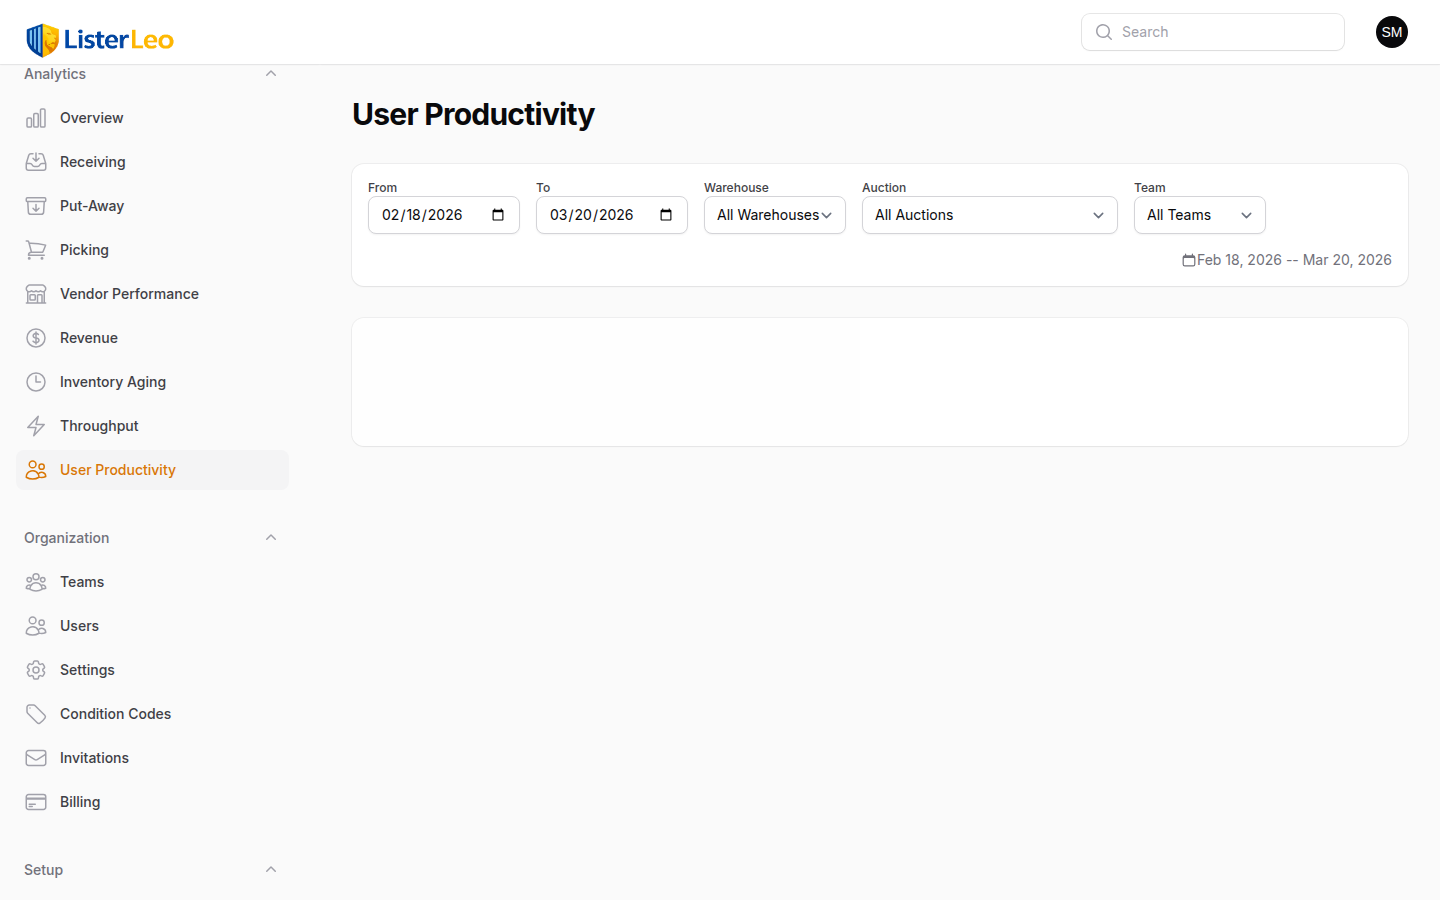
User Productivity
team-lead org-admin org-ownerUser productivity reports show how individual team members are performing across scanning, cataloging, put-away, and picking tasks.
Per-User Metrics
One row per user who took any action in the period. Columns:
- Name and Team — User name and the team they belong to (if any).
- Scanned — Items where this user is recorded as
scanned_by. - Cataloged — Items where this user is recorded as
cataloged_by. - Put Away — Put-away activity-log events attributed to this user.
- Picked — Pick-list items where this user is recorded as
picked_by. - Items/Hr — Scanned items divided by the number of distinct one-hour windows during which the user scanned (a rough activity-based rate, not a precise time-clock).
Items/Hr is colour-coded: green at 10+, amber at 5+, red below. Use productivity data for constructive team coaching, not punitive monitoring. Top performers often have workflow tricks they can teach others.